GeneWalk
Overview

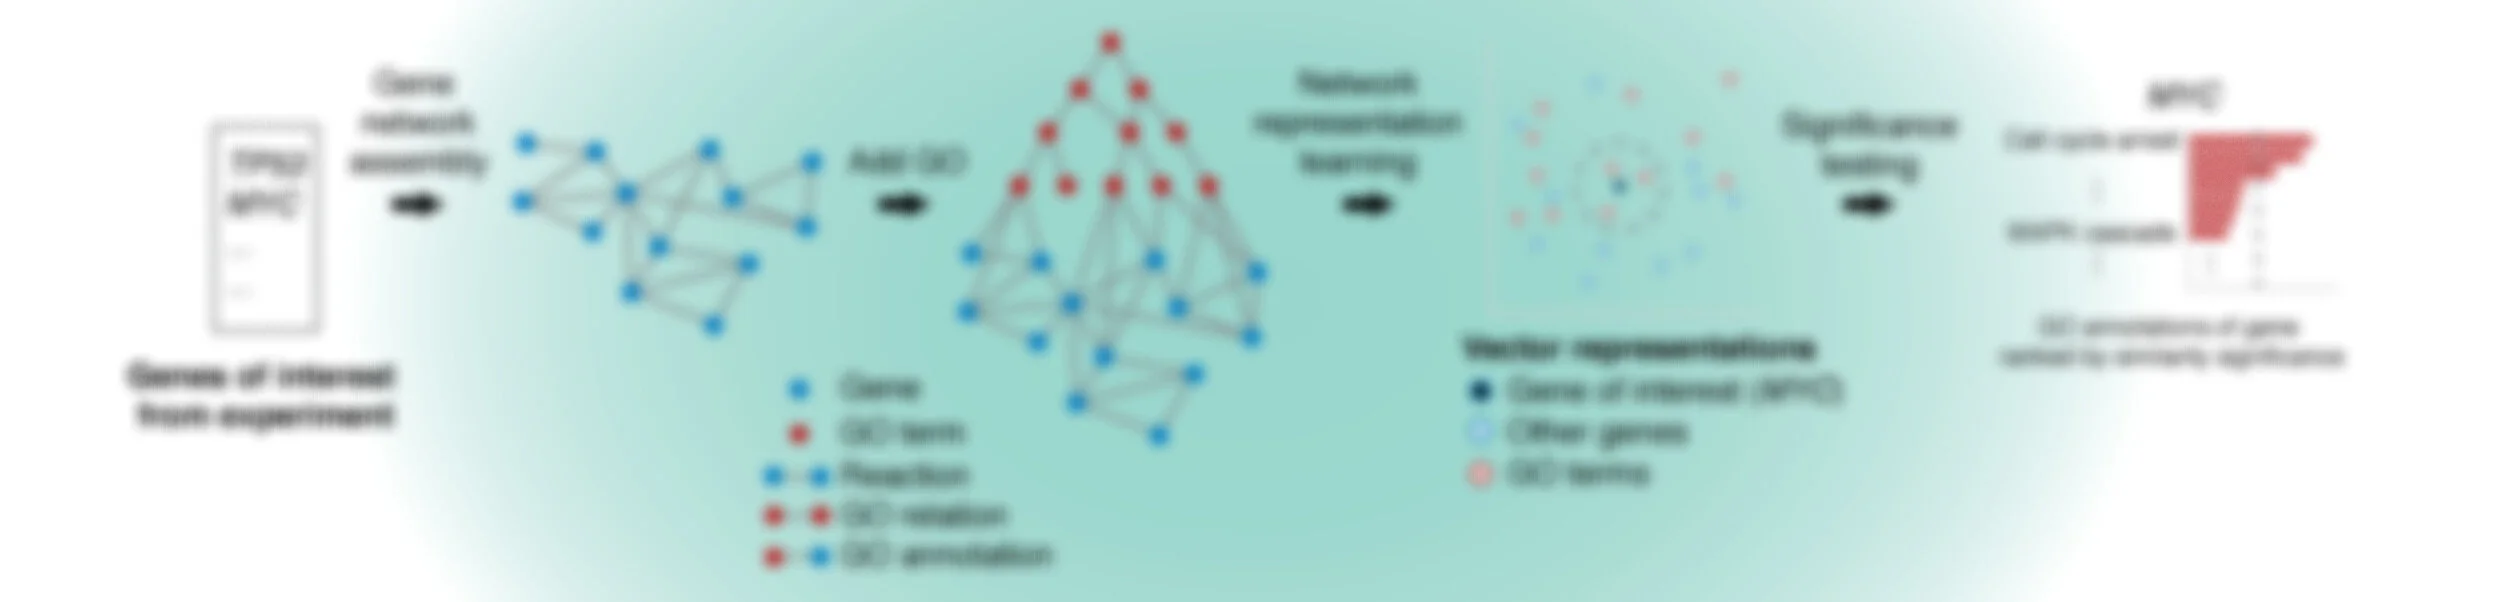
GeneWalk determines for individual genes the functions that are relevant in a particular biological context and experimental condition. GeneWalk quantifies the similarity between vector representations of a gene and annotated GO terms through representation learning with random walks on a condition-specific gene regulatory network. Similarity significance is determined through comparison with node similarities from randomized networks.
Tutorial
1. Prepare a gene list
GeneWalk requires as an input a text file containing a list with genes of interest relevant to the biological context. In this tutorial we use differentially expressed genes that result from the Qki gene deletion (context) in an RNA sequencing experiment on mouse brains.
We prepare a text (.csv) file with MGI gene IDs of all mouse DE genes (up and down regulated) together. The file can be found here. Each line contains a gene identifier.
TIP (optional): order the genes according to differential expression (DE) strength so that your top hits are listed first. The GeneWalk output file maintains this gene order for your convenience. Likewise, ordering input genes by DE fold change facilitates easy separation of GeneWalk results for up and down regulated genes.
In general, GeneWalk currently supports gene list files containing HGNC human gene symbols, HGNC IDs, mouse gene IDs (with or without MGI: prefix), rat gene IDs, Ensembl human gene IDs, human or mouse Entrez IDs. To run GeneWalk with other organisms, see also section 6 below for additional instructions.

2. Install GeneWalk
GeneWalk is built in Python 3 (version 3.5 or higher). Check python.org on how to install Python on your computer. Then simply install GeneWalk by running in your terminal:
pip install genewalkTIP: If this installation gave rise to any errors, this is most likely due to conflicting version dependencies with other Python packages installed on your system. We recommend to activate a new virtual environment and install (and run) GeneWalk from there.
3. Run GeneWalk
GeneWalk can be run as a stand alone program in your terminal:
genewalk --project qki --genes /home/QKI_forGW.csv --id_type mgi_idReplace /home/QKI_forGW.csv with your input file path. The expected run time will be 6-12 hours. RAM requirements: 16-32Gb.
TIP: reduce the runtime to 1-2 hours through parallelization. Many computers have 4 (or more) processors, make use of them by adding --nproc 4 to the above command:
genewalk --project qki --genes /home/QKI_forGW.csv --id_type mgi_id --nproc 4
GeneWalk will run and generate a folder according to the chosen project name /home/genewalk/qki/ to save all results files. For example, it provides a log text file genewalk_all.log to follow its progress.
genewalk --help
provides explanation of various optional arguments. For more details on how to customize the command to your needs, check out our GitHub page.
Below we explain the GeneWalk algorithm in more detail. If you are more interested in the output results, feel free to proceed with step 4.
GeneWalk network assembly
First, the mouse genes are mapped to human orthologs. It is expected that not all mouse genes can be mapped. The program provides warnings for these cases to make you aware but continues to run as expected. In our case of QKI, we find that for ~5% of our 1861 input genes no human homolog was found and are not included for further analysis.
Next, all reactions between the input genes are extracted from a knowledge base, for instance INDRA or in this case Pathway Commons, and automatically assembled into a gene network. This key step enables function relevance predictions that are specific to the experimental context.
Some input genes have no reactions with other input genes so there is insufficient context-specific information on that gene to make relevance predictions and thereby not included in the GeneWalk network. Overall we find for QKI that ~85% of the input genes are present in the network and end up having annotation relevance scores. The other genes will not have any GO annotations as output.
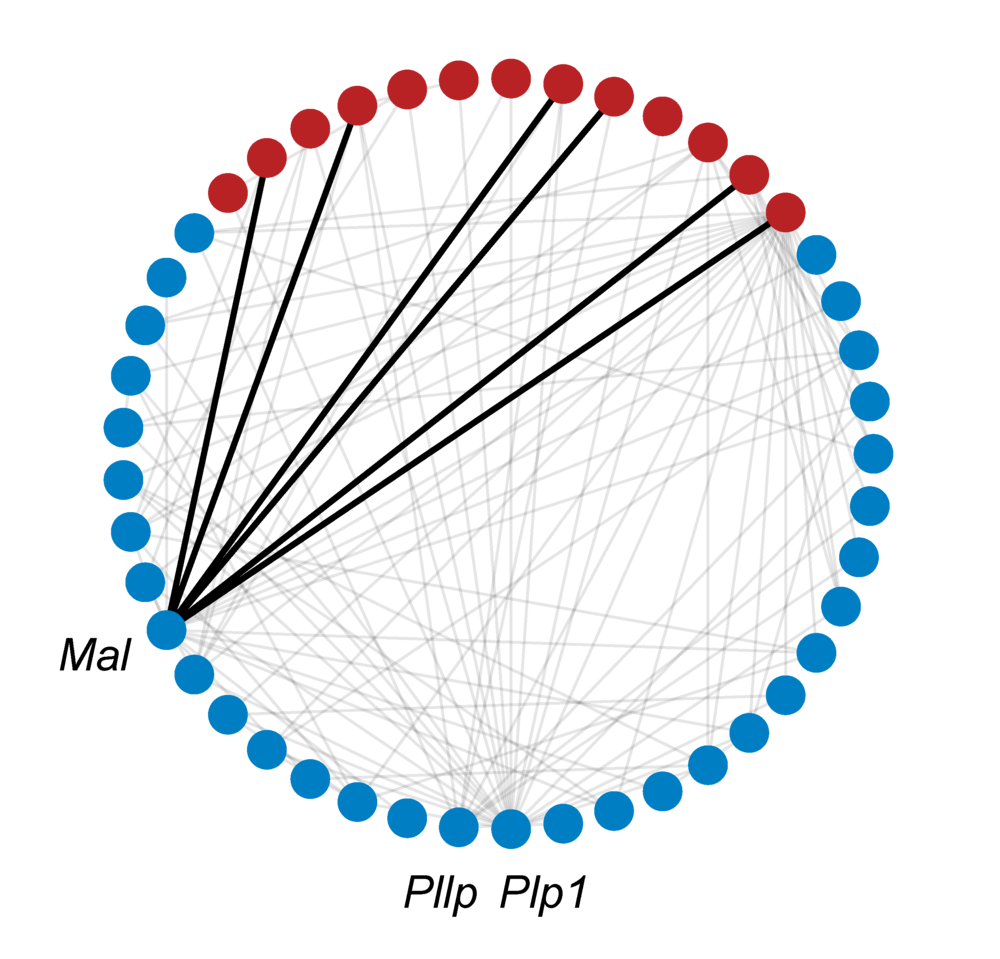
Lastly, the GO ontology and annotations are added to the network, resulting in the full GeneWalk network. For QKI, the subnetwork related to DE genes Mal, Pllp and Plp1 and their annotations is visualized to give an impression of the amount of knowledge available on just three genes. To visualize a GeneWalk subnetwork around selected genes or GO terms of interest, a Python script can be found here.
Network representation learning
To determine how genes and GO terms constituting the GeneWalk Network relate to one another, we apply a network representation learning algorithm based on random walks (DeepWalk) that was first developed for social media networks. In essence it converts network nodes to vectors based on the structure of the GeneWalk network: groups of interconnected genes and GO terms that are mechanistically or functionally linked to each other occur most frequently as gene–GO term neighboring pairs on the sampled random walks and will look similar in vector representation as quantified by their cosine similarity. For more details see our publication.
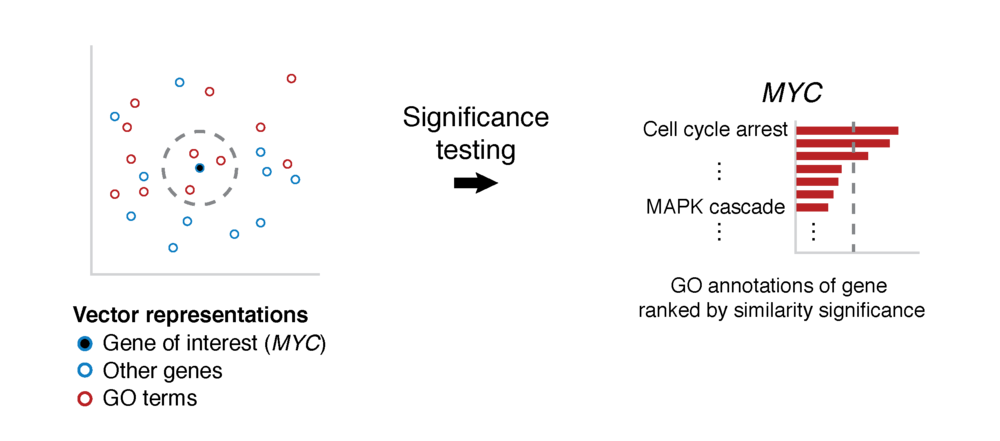
Significance testing
Next, GeneWalk calculates whether a cosine similarity value between a gene and GO term is higher than expected by chance using a significance test. By comparing the similarity to similarity values between node vectors arising from random networks, we obtain a p-value. Because a gene can have multiple GO annotations, we apply a multiple testing correction (Benjamin-Hochberg false discovery rate FDR procedure), yielding a corrected p-adjust value. This procedure is repeated multiple times to retrieve a robust estimate (gene p-adjust) and its uncertainty (95% confidence interval) as statistical significance relevance results for a chosen gene of interest. To consider the GeneWalk results of all (or many) genes, we recommend using global p-adjust values, which corrects for multiple testing over all gene-GO term pairs in the output file.


4. Interpretation of GeneWalk results
The output of GeneWalk is a comma separated text file genewalk_results.csv with GO annotations (go_name and go_id columns) ranked quantitatively by statistical significance, the FDR adjusted p-values (global_padj), for each input mouse gene (mgi_id). Its mapped human ortholog (hgnc_symbol, hgnc_id) and the GO domain of the annotation are also indicated.
So from here you can search for your gene of interest and directly see its GO annotations ranked by their relevance.
Some input genes do not have any GO annotations, so no relevance scores could be generated. If an input gene is missing from the output file, one can look at the genewalk_all.log text file to see why the input gene could not be included for analysis. Overall, we find for QKI that over 85% of the input genes do have annotation relevance scores.

Besides, global p-adjust, GeneWalk also provides gene p-adjust values, which is appropriate when investigating one (or a few) genes of interest. See the section significance testing above for further explanation. By default the global p-adjust values are used for automated visualization of all GeneWalk results (described in step 5).
An FDR significance level (default: global_padj < 0.1) can be used as a threshold to classify GO annotations as significant or not in this particular experimental context. Also shown is the number of connections the gene and GO term have in the GeneWalk network (ncon_gene and ncon_go respectively).
For completeness, the results file also provides the p-value (not adjusted for multiple annotation testing) and the cosine similarity (sim and its standard error: sem_sim). Lastly, we provide 95% confidence interval upper and lower bounds on the global_padj, gene_padj and pval estimates (not shown).
TIP (optional): to perform a connectivity analysis as described in our publication programmatically: the GeneWalk network (networkx format) itself is also output as a multi_graph.pkl file (pickle binary format), which can be loaded into Python for further analysis.
More details on the output can be found on our GitHub page.
5. Visualization
GeneWalk automatically generates figures to visualize its results in the project qki/figures sub-folder. The file index.html can be opened in a browser (e.g. Google Chrome) and includes all the plots, as described below.
To investigate an individual gene, a bar chart of GO annotations ranked according to their relevance score the -log10(global_padj). Here we show the GeneWalk results for the Plp1 gene.
TIP: the error bars correspond to the 95% confidence intervals. The red dashed line indicates FDR significance level of 0.1. Multiple annotations can have similar relevance levels. So have a look beyond the top GO annotation in your GeneWalk results list.
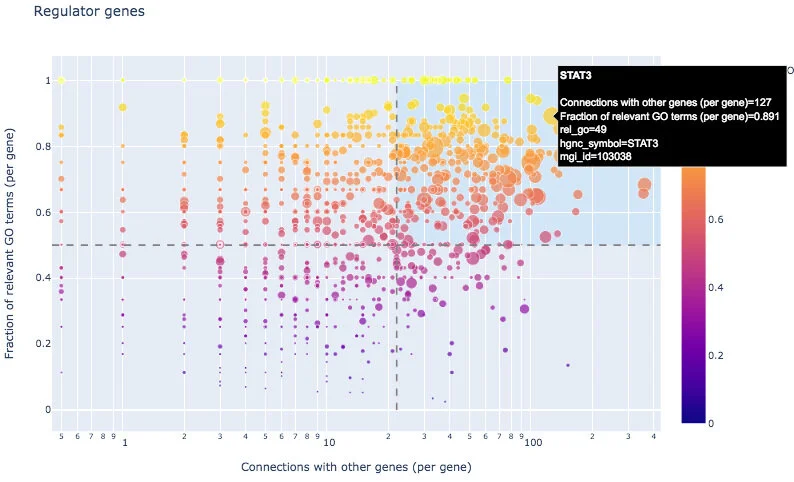
With an interactive scatterplot, one can identify regulator genes from the input list: those with a large connectivity to other input genes and high fraction of relevant GO annotations, for example STAT3. The resulting regulators located in the top right area are also listed in genewalk_regulators.csv.
GeneWalk can also identify moonlighting genes, those with many GO annotations of which a low fraction are relevant (bottom right area), for example GSN. Moonlighters are listed in genewalk_moonlighters.csv.
For completeness, all the regulator and moonlighter scatter plots data are output in genewalk_scatterplots.csv. For more information on how to interpret these results, see our publication.
To be more selective with regulator and moonlighter gene identification, rerun the visualization stage of genewalk with an FDR significance level (--alpha_fdr) lower than its default value 0.1 (run time: 1-10 minutes):
genewalk --project qki --genes /home/QKI_forGW.csv --id_type mgi_id --stage visual --alpha_fdr 0.075
The GO annotation barplots for all individual genes are located in the figures/barplots sub-folder. For more information on the automated visualization, check out our github page. In the links below we also provide Python and R code to generate relevance ranking barplots with gene p-adjust and to plot customized regulator and moonlighter scatterplots.
A circular GeneWalk subnetwork around a few chosen genes or GO terms of interest can be visualized in Python with the script below. The whole network consists of more than 40,000 nodes, generally too large to visualize it as a whole in an interpretable manner.


6. GeneWalk for other model organisms
GeneWalk is fully automated for human, mouse and rat gene lists. However, for other organisms there are several options to run GeneWalk.
The first strategy is to map a list of genes from another organism to their human orthologs by yourself. GeneWalk can then be run with the human ortholog list as input as described above. Use this strategy if you consider the organism sufficiently related to human.
The second method is to provide an input gene file with custom gene IDs (--id_type custom). These are not mapped to human genes. Use custom gene IDs for more divergent organisms, such as drosophila, worm, yeast, plants or bacteria. In this case the user must also provide a custom gene network with GO annotations as input.
Now, we briefly describe how to generate such an input genewalk network file. A network can be encoded as a sif: simple interaction format.
This is a text file where each row describes an edge between two nodes in the network. formatted as follows:source_node,<relationship type>,target_node.
To acquire the gene-gene relations, query an organism-specific knowledge base, for example STRING or BioGRID. These gene source and target nodes must correspond to the gene ids from the input gene list. The relationship type is not important for GeneWalk and can be left blank. GO annotations are rows where the source node is a gene ID and the target node a GO term. Use GO IDs with prefix (for example GO:0000186) to encode GO terms. Organism-specific GO annotations files can be downloaded from the GO consortium webpage. Do not include column headers in the network file.
Once the network file (network_sif_file.txt) is prepared, GeneWalk can then be run with the following command:
genewalk --project model_org --genes gene_list.txt --id_type custom --network_source sif_annot --network_file network_sif_file.txtMore options on how to format custom input networks are described on our github page.
When a model organism is related to human, but also contains organism-specific genes, a third option is to combine the two approaches above:
First run GeneWalk with the the human ortholog list only.
Then load the GeneWalk network (multi_graph.pkl as described above) into Python and use networkx to save the file as a sif or edge list file.
Augment this network file by appending organism-specific gene-gene interactions and gene-GO annotation rows manually or with the use of external sources and gene annotation files.
Lastly, run GeneWalk with the custom gene ids option and the augmented genewalk network:
genewalk --project augment_org --genes gene_list.txt --id_type custom --network_source sif_full --network_file augmented_network_file.txtMore info on GeneWalk
Further documentation
For more details on how to install GeneWalk and run it on your data, checkout our GitHub page.
For further code documentation see our readthedocs page.
Find further information about the GeneWalk methodology and applications in our publication.
Citation
Robert Ietswaart, Benjamin M. Gyori, John A. Bachman, Peter K. Sorger, and L. Stirling Churchman
GeneWalk identifies relevant gene functions for a biological context using network representation learning (2021), Genome Biology 22, 55 (2021), https://doi.org/10.1186/s13059-021-02264-8
Funding
This work was supported by National Institutes of Health grant 5R01HG007173-07 (L.S.C.), EMBO fellowship ALTF 2016-422 (R.I.), and DARPA grants W911NF-15-1-0544 and W911NF018-1-0124 (P.K.S.).