Tools / GeneWalk
GeneWalk
Your differential expression list came back with two thousand genes and every one of them has forty GO annotations. GeneWalk tells you which of those annotations actually matter in the condition you studied — by learning vector representations of genes and GO terms on a context-specific network and testing similarity against randomised networks.
Quick start
pip install genewalk

genewalk --project qki \
  --genes /path/to/QKI_forGW.csv \
  --id_type mgi_id \
  --nproc 4
Runtime is 6–12 hours single-threaded, or 1–2 hours with --nproc 4. Budget 16–32 GB of RAM. Results land in ./genewalk/<project>/, with progress in genewalk_all.log.
Supported identifiers
HGNC human gene symbols and IDs; mouse MGI IDs (with or without the MGI: prefix); rat gene IDs; Ensembl human gene IDs; human or mouse Entrez IDs. Other organisms are supported viacustom networks.
Tip
Order your input genes by differential expression strength. GeneWalk preserves that order in the output, which makes it easy to separate up- and down-regulated results afterwards.
How it works
1. Network assembly
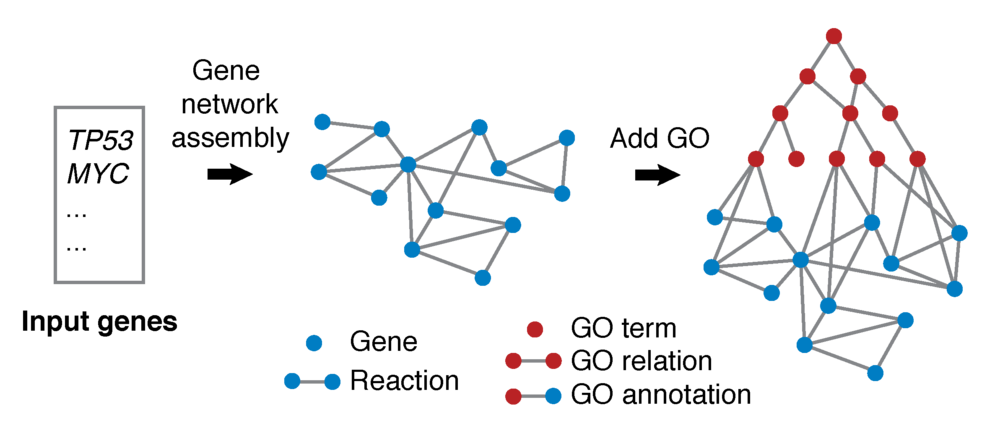
Non-human genes are first mapped to human orthologs — not all will map, and GeneWalk warns rather than failing. Reactions between the input genes are then pulled from a knowledge base (INDRA or Pathway Commons) and assembled into a gene network. This is the step that makes the predictions specific to your experimental context. Genes with no reactions to other input genes carry too little context-specific information and are dropped; in the QKI example about 85% of input genes survive into the network. Finally the GO ontology and annotations are layered on.
2. Network representation learning
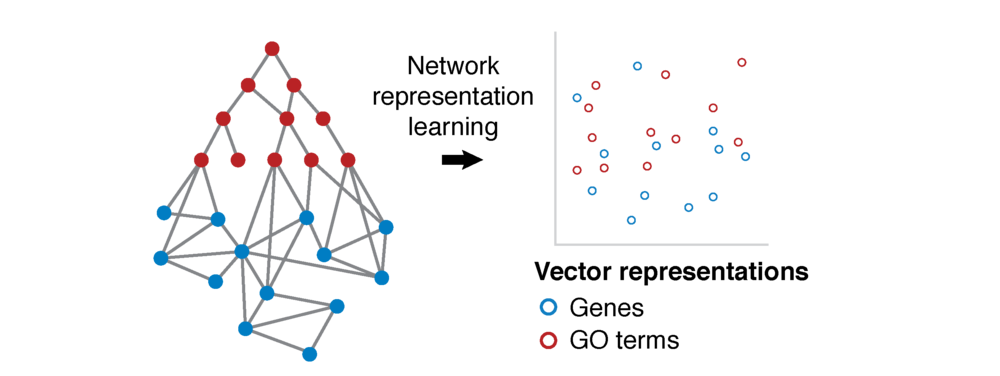
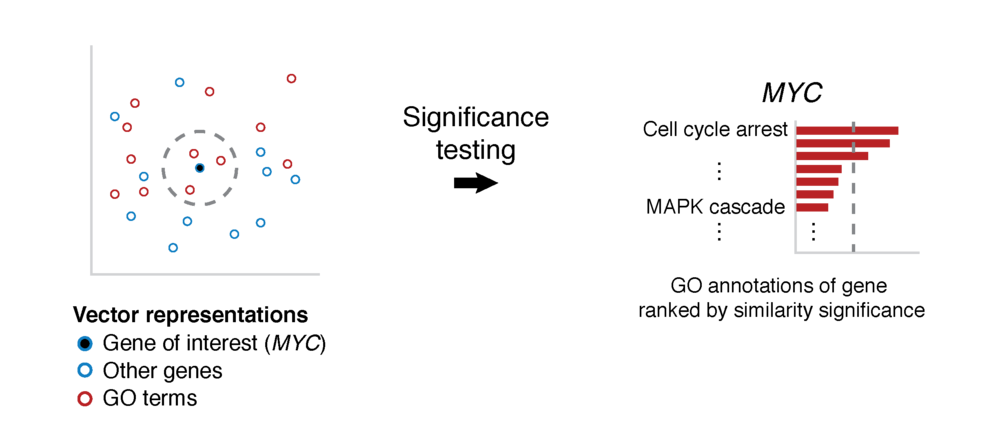
A random-walk representation learning algorithm (DeepWalk, originally built for social networks) converts nodes to vectors. Groups of genes and GO terms that are mechanistically or functionally linked show up most often as neighboring pairs on the sampled walks, and end up with similar vectors as measured by cosine similarity.
3. Significance testing
GeneWalk asks whether each gene–GO cosine similarity is higher than expected by chance, comparing against similarities from randomised networks to get a p-value. Because a gene has many annotations, a Benjamini–Hochberg FDR correction is applied, and the whole procedure is repeated to give a robust estimate plus a 95% confidence interval. Use global_padj when considering all genes together and gene_padj when focusing on one gene.
Reading the output
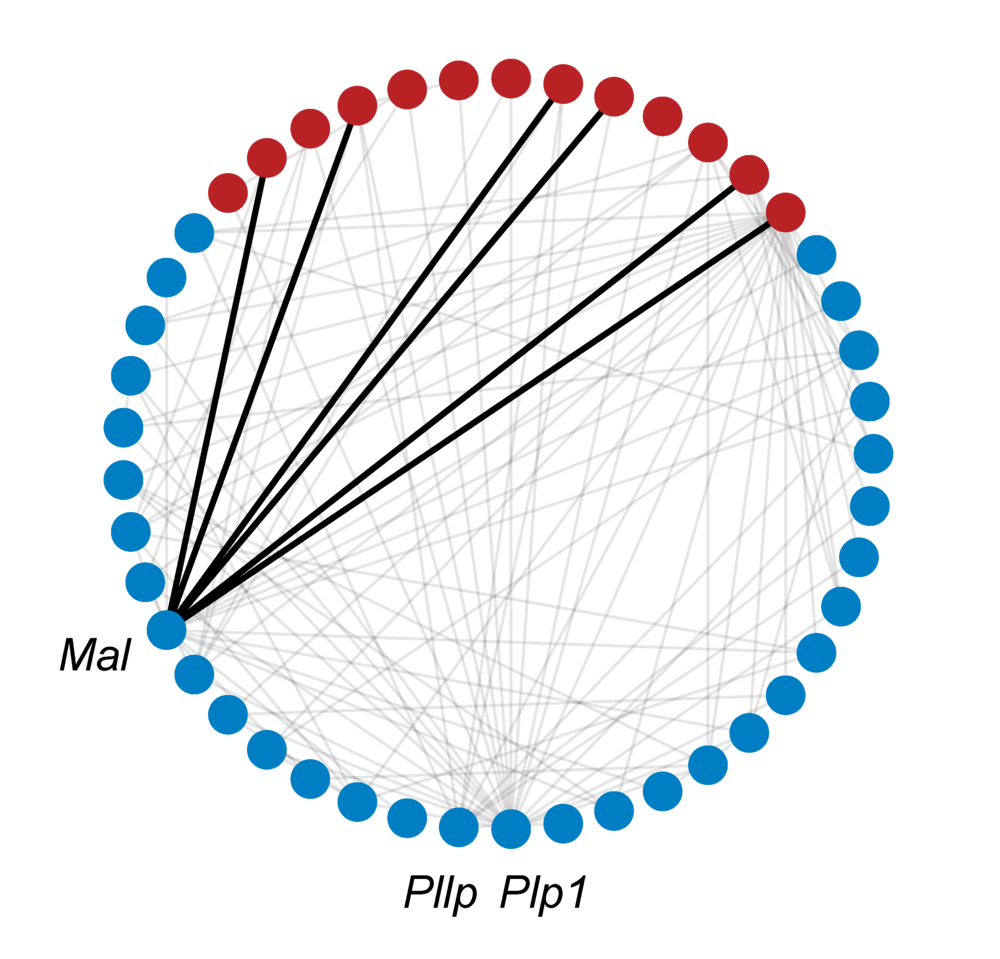
genewalk_results.csv lists GO annotations (go_name, go_id) ranked by FDR-adjusted p-value for each input gene, along with the mapped human ortholog, the GO domain, and the number of network connections for gene and GO term (ncon_gene, ncon_go). A threshold of global_padj < 0.1 is the default significance level.
If an input gene is missing entirely, genewalk_all.log explains why. The network itself is also written as multi_graph.pkl (networkx, pickled) for programmatic connectivity analysis.

Visualization
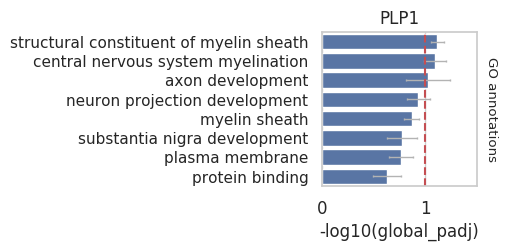
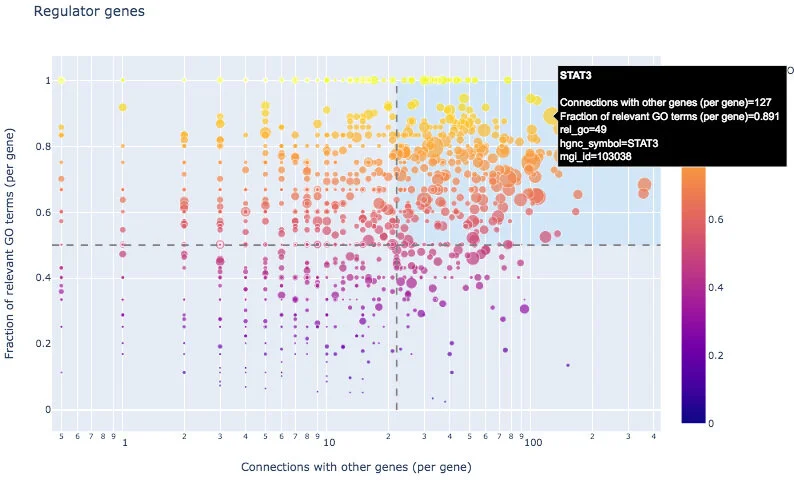
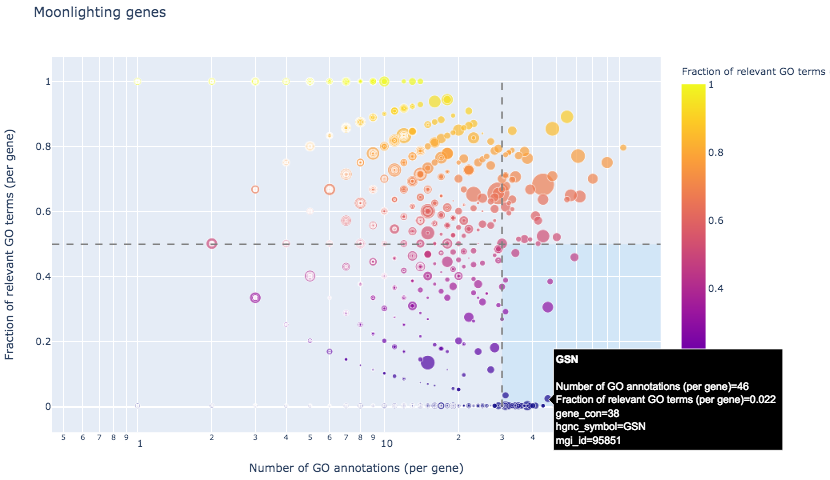
GeneWalk writes figures into <project>/figures; open index.html in a browser to see all of them. Per-gene bar charts rank annotations by -log10(global_padj) with 95% confidence intervals. Interactive scatterplots identify regulators — highly connected genes with a high fraction of relevant annotations — and moonlighters, genes with many annotations of which few are relevant.
To be more selective, re-run only the visualization stage with a tighter FDR (1–10 minutes):
genewalk --project qki --genes /path/to/genes.csv \
--id_type mgi_id --stage visual --alpha_fdr 0.075Other model organisms
GeneWalk is fully automated for human, mouse and rat. For anything else there are three routes.
Map to human orthologs yourself
Simplest option if the organism is close enough to human. Run GeneWalk on the ortholog list as normal.
Supply a custom network
For divergent organisms — Drosophila, worm, yeast, plants, bacteria — use--id_type custom and provide your own network in simple interaction format (source_node,<relationship type>,target_node, no header row). Gene–gene edges can come from STRING or BioGRID; gene–GO edges use GO IDs with prefix (e.g. GO:0000186), downloadable from theGO consortium.
genewalk --project model_org --genes gene_list.txt \
  --id_type custom --network_source sif_annot \
  --network_file network_sif_file.txt
Augment a human network
For organisms that are human-adjacent but carry organism-specific genes: run on human orthologs first, load multi_graph.pkl into networkx, export as an edge list, append your organism-specific gene–gene and gene–GO rows, then re-run with --network_source sif_full.
Citation
Robert Ietswaart, Benjamin M. Gyori, John A. Bachman, Peter K. Sorger, and L. Stirling Churchman.GeneWalk identifies relevant gene functions for a biological context using network representation learning. Genome Biology 22, 55 (2021).doi.org/10.1186/s13059-021-02264-8
Funding
Supported by National Institutes of Health grant 5R01HG007173-07 (L.S.C.), EMBO fellowship ALTF 2016-422 (R.I.), and DARPA grants W911NF-15-1-0544 and W911NF018-1-0124 (P.K.S.).